Curricular Analytics Heading link
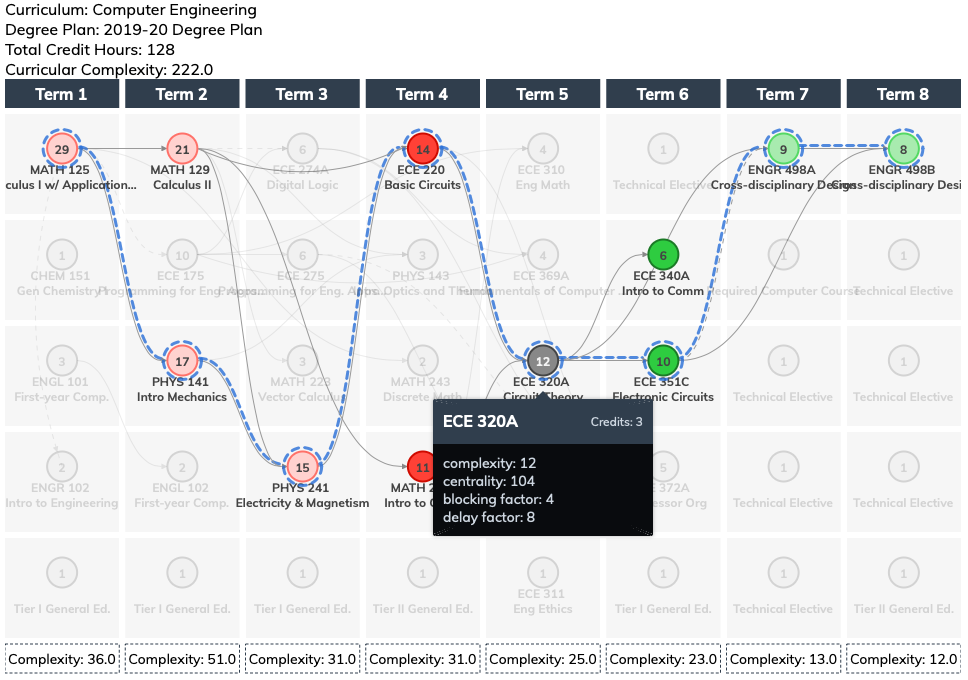
Curricular Analytics provides tools that allow departments to visualize their curricula and degree plans in an effort to analyze how these impact student progress and completion. Presented as interactive visualizations, term-by-term degree plans can be analyzed, providing various metrics associated with individual courses as well as the overall curricular complexity.
Using the UIC 2023-2024 Undergraduate Catalog, 88 individual degree programs across eight undergraduate colleges have been updated and entered into the Curricular Analytics system.
The metrics that are provided within the Curricular Analytics visualizations include:
- Blocking Factor – Measures the extent to which a course blocks the ability to take other courses in the curriculum;
- Delay Factor – Represents the length of the longest path in the corresponding curriculum that contains a set of courses that must be completed in sequential order;
- Centrality – Captures the extent to which a course can be thought of as being central to the curriculum by its relations to other courses;
- Structural Complexity – Identifies the overall complexity of the entire curriculum by capturing the total number of courses that make up the curriculum and the number of prerequisites, co-requisites and strict co-requisites each course has.
Taken together, these metrics can be helpful when considering curriculum redesign, academic program review, new program creation, or curricular comparison with other participating universities.
Contact Amy Knetl (aknetl@uic.edu) for information on how to create an account.